Global Situation and Risk Intelligence Decision Platform
An export control update, a port disruption, or escalating regional tensions: the challenge is not missing the news, but being unable to pinpoint which operating facility or supplier is impacted. InfoMiner Global Situation and Risk Intelligence Platform centers on incident maps, relationship knowledge graphs, and tiered risk alerting—cross-referencing global events against institutional exposure matrices to transform macro signals into actionable tasks with assigned owners.
What Is a Global Situation and Risk Intelligence Platform?
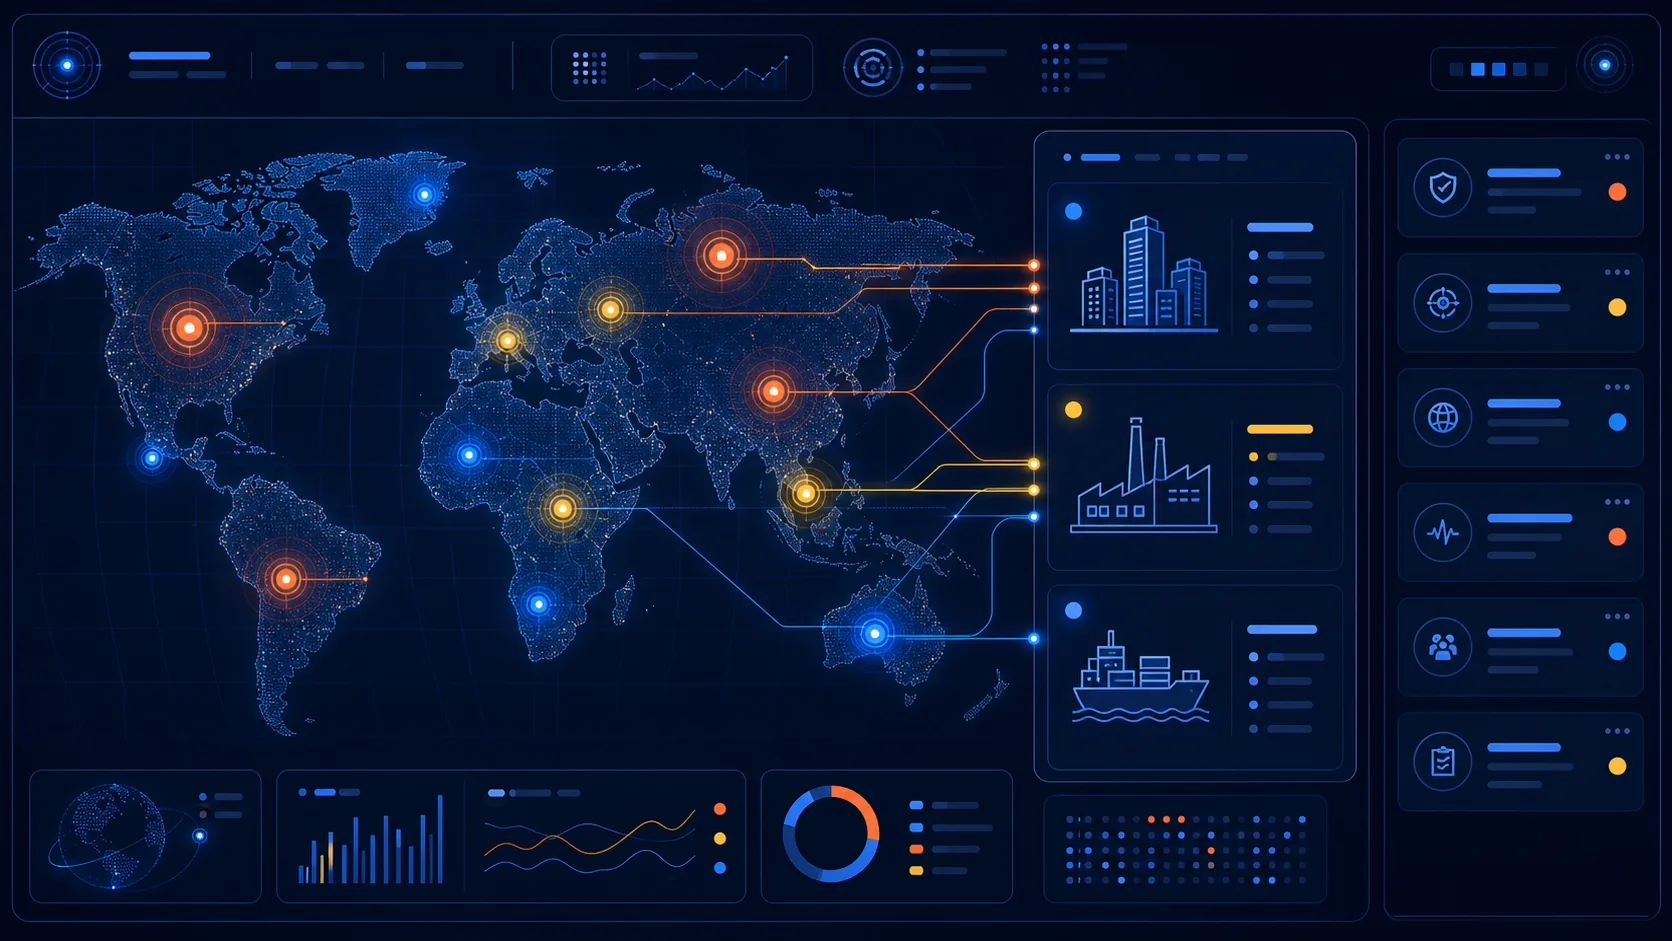
A Global Situation and Risk Intelligence Platform is a decision-support system integrating international news, social feeds, policy announcements, enterprise filings, and open datasets—transforming fragmented signals into synthesized incidents, entity graphs, and risk tiers while continuously cross-referencing organizational exposure. The distinction from legacy news monitoring lies not in data volume, but in operational output: news monitoring delivers reading backlogs; risk intelligence delivers meeting-ready executive insights: 'Which operating site or supplier does this event impact?'
Linking global events to agency mandates, enterprise operations, physical facilities, and supply chain exposures to produce actionable risk intelligence.
InfoMiner Global Situation and Risk Intelligence Platform builds on proven large-scale ingestion infrastructure to establish incident deduplication, exposure correlation, and tiered alerting workflows. For category definitions and procurement checklists, refer toWhat is a global situational intelligence platform? From news monitoring to decision support; this page focuses on product positioning, operational scenarios, and implementation workflows.
Who it is for
- Government Agency Situation Aides and Policy Evaluation Units: Daily regional intelligence tracking, assessing jurisdictional policy impacts.
- Enterprises with overseas operating sites, suppliers, or foreign markets: Risks predominantly emerge from blind spots beyond direct vision.
- Financial Institutions and Investment Research Teams: Translating sovereign and industry events into quantifiable exposures across holdings, credit facilities, and counterparties.
What problems it solves
- Too many global events unfold daily, obscuring which ones genuinely impact your agency or enterprise.
- Global incidents are visible, yet teams cannot articulate exposures across specific sites, suppliers, or logistics routes.
- Exposures are recognized, yet lack routing rules and disposition logs—stalling in chat group links without actionable assignment.
Why Is a Global Situation Intelligence Platform Needed Now?
Traditional intelligence workflows relying on manual press clipping, departmental rotations, and periodic analytical reports are not deficient in effort, but outpaced by three macro shifts: event velocity, cross-domain cascading impacts, and accelerated decision windows.
1. Event Density and Velocity: Measured in Days, Not Quarters
Policy announcements, sanctions/export control updates, regional conflicts, natural disasters, supplier disruptions, strikes, and port congestion occur daily, yet officers can only consistently monitor a handful of familiar outlets. Subscribing to more newsletters cannot bridge this gap; the bottleneck is human reading throughput—wasting hours recognizing duplicate coverage of already-seen events.
2. Cross-Domain Cascade: A Single Shift Triggers Multiple Vectors
A single export control amendment cascades simultaneously across supplier deliveries, maritime transshipment routing, international customer purchase orders, and public industry guidance. In an isolated news feed, it reads as a generic foreign dispatch; uncovering internal relevance demands cross-referencing events against supplier, site, and customer rosters—an analytical feat manual effort can only achieve for a tiny fraction of cases.
3. Decision Window: Mitigation Timelines Close Faster Than Report Cycles
Operational mitigation windows are fleeting: re-routing purchase orders, securing inventory buffers, adjusting logistics routes, releasing proactive statements, or pausing regional operations. By the time a comprehensive formal report clears executive review, the mitigation window has closed, demoting reports from decision drivers into post-mortem explanations. The platform collapses the latency from incident occurrence to active human remediation.
Three-Layer Architecture: Incident Layer, Exposure Layer, Action Layer
This represents the fundamental differentiator between our platform and generic news map dashboards. Most tools stop at the Incident Layer—pinning events onto a world map—whereas superior decision quality is won in the latter two layers. The Incident Layer answers 'What happened and where?'; the Exposure Layer answers 'How does this impact my agency, enterprise, facilities, and supply chain?'; the Action Layer answers 'Who should be alerted, what actions must be taken, and how do we track execution?'
| Layer | Question answered | Input Data | Typical output |
|---|---|---|---|
| Event layer | What happened, and where | Multilingual news, social signals, government bulletins, open registries | Incident summary, chronological timeline, geolocation, and primary source directory |
| Exposure layer | How this impacts my agency, enterprise, operating sites, and supply chain | Incident directory paired with proprietary organizational exposure asset matrices | Mapping matrix of impacted facilities, suppliers, shipping corridors, and business lines |
| Action layer | Who to notify, what to do, and how to track it | Exposure mapping results, severity grading rules, operational RACI matrices | Tiered notification logs, remediation tasks, execution progress, post-incident reviews |
Event layer: consolidating reports into events
The Incident Layer organizes massive streams of reports, posts, and bulletins into structured incident units: deduplicating syndicated articles, categorizing events, generating chronological storylines, and hyperlinking every dispatch to original sources. The platform provides incident maps and timeline views revealing localized incident accumulation. Delivering this layer is merely baseline compliance; its output is still limited to 'what happened globally.'
Exposure layer: connecting events back to yourself
The Exposure Layer delivers the highest operational ROI and demands proprietary organizational inputs. Its prerequisite is an Exposure Asset Matrix: foreign sites, personnel locations, primary suppliers, manufacturing fabs, critical Tier-2 suppliers, shipping lanes, and strategic accounts. Utilizing relationship knowledge graphs, the platform correlates geolocations and corporate entities against this matrix, turning distant dispatches into actionable clarity: 'A Tier-2 supplier for Production Line B resides within the impacted zone.'
Action layer: turning assessment into something someone owns
The Action Layer solves the last mile: what severity tier triggers alerts to whom, which incident response SOP applies, who owns remediation, and how progress is logged. The platform provides tiered notification triggers and mitigation task ledgers, or integrates into legacy ticketing/approval suites. The imperative is preserving an audit trail: auditably explaining what determinations were made when crisis struck.
5 Stages of Global Situation Intelligence
The Three-Layer Architecture defines system topology, while the Five Stages trace data flows: Perceive, Correlate, Assess, Alert, and Act. Stages 1–2 build the Incident and Exposure Layers; Stages 3–5 transform exposures into governance decisions and operational remediations.
| Phase | What it does | Typical output |
|---|---|---|
| 1. Sensing | Configure surveillance boundaries by target regions, industries, and topics, continuously ingesting multilingual news, social media, policy decrees, and open registries | Raw signal pool, source provenance records, anomaly signal flags |
| 2. Correlation | Merge signals into events, identify the locations and organizations involved, and match against the exposure asset inventory | Event list, relationship knowledge graph, affected entity mapping |
| 3. Assessment | Evaluate blast radius and projected trajectory, recommending severity tiers while strictly separating AI inferences from human assessments | Impact assessment, risk tier, evidence citations, pending verification items |
| 4. Alerting | Determine recipient rosters, delivery channels, and escalation SLAs based on risk tiers and departmental ownership | Tiered notifications, receipt logs, escalation triggers |
| 5. Action | Map to established incident response procedures, assign owners, and track remediation progress | Remediation tasks, progress logs, post-incident review archives |
Stage 1: Perception (Ensuring complete capture without data loss)
The Perception stage converts dynamic external global events into a computable data stream. Surveillance scopes are configured around target regions, industry verticals, and geopolitical topics—incorporating designated local media publishers, regulatory bulletins, and client-supplied feeds. This stage makes no value judgments, ensuring zero data loss within configured boundaries while flagging anomaly signal clustering across specific themes or territories. Source coverage sets the ceiling for subsequent stages and should be updated whenever new operational sites onboard.
Stage 2: Correlation (Processing each unique incident once)
The Correlation stage performs two critical tasks. First is Incident Deduplication: clustering disparate articles covering the same underlying event into a single synthesized incident docket with chronological storylines and source inventories—transforming daily reading from article counts into incident counts. Second is Exposure Mapping: extracting geographic entities and corporate organizations to cross-reference against proprietary exposure matrices, flagging impacted operating sites, suppliers, and key accounts. Global events transform from passive news into actionable institutional priorities.
Stage 3: Assessment (AI inferences and human interpretations archived separately)
The Assessment stage evaluates blast radius, projected trajectory, and risk severity for each exposure-linked incident; the platform synthesizes historical precedents and involved counterparties to recommend risk tiers. However, because impact evaluation depends on proprietary business context and organizational risk appetite, AI inferences and human review determinations remain strictly separate fields: AI delivers synthesis and recommendations, while human analysts confirm severity tiers and operational direction—both preserved for auditable provenance.
Stage 4: Alerting (Routing actionable intelligence to rightful stakeholders)
The Alerting stage dictates notification recipients, delivery channels, and escalation SLAs based on risk tiers and operational mandates. Client-configured routing matrices define tiers: which tier routes to daily briefing digests, which triggers instant push alerts to line-of-business directors, and which escalates immediate emergency cross-departmental incident bridges. This architecture avoids two failure modes: alert fatigue where everyone receives everything and reads nothing, or overly restrictive thresholds where critical events go unnotified.
Stage 5: Action (Establishing a closed-loop tracking workflow)
The Action stage transforms alerts into assigned mitigation tasks: mapping applicable response SOPs, assigning lead departments, setting reporting deadlines, and tracking operational execution. Post-incident reviews are archived upon event de-escalation, preventing teams from conflating 'notification delivered' with 'risk mitigated.'
Three Major Application Scenarios
Scenario 1: Daily Geopolitical Briefings for Government Agencies
Foreign affairs departments, industrial regulators, and critical infrastructure agencies must grasp regional developments before morning deadlines, identifying which issues require talking points and which demand inter-agency coordination. The platform formats standardized daily briefings for executive morning meetings:
- Today's Core Incidents:Ranked by risk tier and jurisdictional relevance, citing evidentiary sources and primary references.
- Relevance to Jurisdictional Operations:Outlines which regulated industry sectors, operating bureaus, and target stakeholders are affected.
- Stakeholder Stances and Forward Trajectory Assessments:Synthesizes public statements across stakeholders, strictly separating confirmed facts from forward-looking inferences.
- Recommended Watchlists and Action Directives:Itemizes indicators to monitor, preliminary preparations to initiate, and assigned lead departments.
This briefing can integrate directly with existing domestic public sentiment briefs into a unified two-section executive docket, providing leadership with domestic and regional intelligence on a single page.
Scenario 2: Overseas Operations and Supply Chain Risk for Enterprises
Overseas sites introduce personnel and asset security exposures; overseas suppliers introduce material shortages and lead-time risks; overseas markets introduce regulatory shifts. Centering on proprietary exposure asset inventories, the platform maps three event categories to operations: regulatory shifts, labor strikes, and natural disasters in supplier nations; maritime and logistics bottlenecks; and regional unrest and safety bulletins near foreign facilities. The primary dividend is rarely predicting macro shocks, but gaining days of lead time when a Tier-2 supplier's region experiences disruptions—allowing procurement to confirm buffer stocks and alternative suppliers. To evaluate supplier health and compliance concurrently, align with theSupply Chain Security Review Guide evaluation workflow.
Scenario 3: Financial Portfolio and Counterparty Risk Monitoring
Financial institutions and investment research teams focus on how macro events propagate across holdings, credit facilities, and counterparty exposures. Here, exposure matrices become portfolios, credit books, and client rosters; the platform maps country, industry, and corporate events to this inventory, highlighting exposed positions with source provenance. Deliverables avoid market price directional speculation, empowering researchers to verify source citations and counterparties while strictly segregating facts from investment inferences.
Trustworthy Design Principles
The single greatest operational failure in intelligence is when leadership asks 'Where does this information come from?' and staff cannot answer. The platform addresses this mandate through four foundational designs:
- End-to-End Source Provenance:Every incident links back to original news dispatches or official bulletins; summaries and full source texts coexist, ensuring summaries never obscure source provenance.
- Transparent Event Severity Criteria:Severity criteria are documented transparently in the system, auditable, and configurable—not a black-box machine score. When challenged on why an event is flagged high-risk, the system provides auditable, explainable rules.
- Demarcation of AI Inferences and Human Determinations:The system provides synthesized context, correlation, and tier recommendations; final situational assessments are confirmed by human analysts, with both outputs archived alongside reviewer IDs.
- Data Sovereignty and Flexible Deployment:InfoMiner's hosting infrastructure resides domestically within Taiwan under ISO 27001 certification; sensitive datasets can be paired with RAGi on-premise deployments.
Product Synergy: External Intelligence × Internal Knowledge
InfoMiner Global Situation and Risk Intelligence Platform governs the external world: multi-lingual news, social feeds, regulatory notices, and open data ingestion, incident deduplication, and tiered alerting leveraging InfoMiner's 500,000+ channel architecture. RAGi powers internal knowledge: site registries, supplier directories, emergency SOPs, and historical incident records. Transforming external events into corporate exposures requires continuous cross-referencing against internal data, forming a comprehensive risk intelligence operation. To execute models within air-gapped environments, pair with QubicX.
InfoMiner Social Listening · RAGi Enterprise AI Retrieval-Augmented Generation Engine · QubicX On-Premise AI Platform
Implementation Workflow
Implementation success centers not on software infrastructure buildout, but on clearly defining organizational exposure. Clients contribute domain-knowledgeable operational owners and an asset exposure roster rather than software development engineering.
| Phase | Key Tasks | Client Stakeholder Roles | Deliverables |
|---|---|---|---|
| 1. Exposure Inventory Scoping | Consolidate inventories of facilities, suppliers, shipping lanes, and strategic accounts to define monitoring targets | Business, Procurement, Operations, and Risk Officers | Exposure Asset Matrix |
| 2. Scoping and Rule Configuration | Configure monitored regions, topics, and sources against exposure inventories; establish severity grading and notification escalation rules. | Case Officers, Vendor Implementation Consultants | Monitoring scopes, severity grading criteria, notification rules |
| 3. Calibration Pilot Phase | Generate daily situation digests; operational staff provide feedback on prioritization, omissions, and false positive alarms. | Operational Officers | Calibrated severity thresholds and briefing schemas |
| 4. Production Go-Live | Automated delivery of daily briefs and tiered push alerts; role-based operational training and intelligence interpretation coaching. | Executive aides, departmental operational liaisons | Daily situation briefs, tiered alerts, remediation tracking ledgers |
Client effort is most vital during Exposure Scoping and the Calibration Pilot. The exposure inventory dictates whether the platform can map external events to internal operations—without it, even comprehensive surveillance is merely an unmanageable stream of international news. The calibration phase allows case officers to refine prioritization and tune severity thresholds.
Further Reading
- What is a global situational intelligence platform? From news monitoring to decision support
- What is Threat Intelligence? A Complete Enterprise Guide to Threat Intel
- Supply Chain Security Review Guide: Supplier Risk Assessment and Continuous Monitoring
- Defense & Critical Infrastructure Intelligence Solutions
- InfoMiner Government AI Copilot: From Sentiment Monitoring to Policy Decision Support
FAQ
Schedule a Global Situation and Risk Intelligence Demo
Experience an end-to-end walkthrough utilizing your organization's actual facilities and supplier rosters: spanning event ingestion, exposure correlation, tiered alerting, and closed-loop task remediation.
Contact Us